7 Things Every Contact Center Manager Should See Every Day

Most contact center managers start their day the same way: they walk into the office, ask the supervisor “How are things going?”, hear “Everything’s fine,” and move on to other tasks.
“Fine” is not an answer. It is simply the absence of information.
Real contact center management does not start with yesterday’s report. It starts with the numbers you can see right now. Below are seven things that should be visible every single day. Not once a week, not at the end of the month, but daily.
1. Who Is Currently Online and Their Status
The first thing a manager should see is how many agents are actually working right now. Not how many showed up for the shift, but how many are currently available for calls.
An agent can be in four different states: on a call, available to take a call, on pause, or in Post Call Work processing the results of the previous interaction. Every status is normal in the right proportion and at the right time.
The problem starts when the picture looks like this: 12 customers are waiting in the queue, while three out of eight agents are on pause at the same time, and another one has been stuck in Post Call Work for 20 minutes.
Without real time visibility, the manager simply does not know what is happening. And the queue keeps growing on its own.
2. How Many Customers Are Waiting Right Now
Waiting is the number of customers currently sitting in the queue. It is the most “live” metric on the entire dashboard.
If Waiting keeps increasing and nothing changes on the agent side, it is a signal to act immediately, not an hour later. Bring someone back from pause, open an additional queue, or redistribute the workload.
Most managers only learn about queue issues from customer complaints or from end of day numbers like “47 missed calls yesterday.” By then, those customers have already called competitors.
Waiting shows the problem before it turns into a loss.
3. Service Level: Is the Team Responding on Time?
Service Level is the percentage of calls answered within a target timeframe. The most common standard is 80% of calls answered within 20 seconds, although every company sets its own targets.
Why is this important to monitor daily rather than weekly? Because Service Level can drop quickly and almost unnoticed. Today it is 95%, tomorrow afternoon it is already 41%, as shown in one of the queues on the dashboard. If the issue is noticed only in the evening, the day is already lost.
The good news is that in UniTalk Contact Center, managers can set target Service Levels for each queue individually and instantly see where targets are met and where they are not directly in the interface with color indicators.
4. ASA: How Long Customers Actually Wait for an Answer
ASA stands for Average Speed of Answer. It measures the average waiting time before an agent responds. It is a simple number with a major impact on customer experience.
According to Sprinklr (2025), most customers hang up within 30 to 60 seconds of waiting before many companies even have time to react.
An ASA of “00:01:23” for a queue is acceptable. An ASA of “00:03:45” is already a warning sign. And if several agents show numbers like this, it is not a coincidence but a systemic issue with workload or call distribution.
One quick look at queue ASA metrics in the morning and a manager already knows where something is going wrong before the first complaint appears.
5. Abandon Rate: How Many Customers Hang Up Before Reaching an Agent
Abandon Rate is the percentage of customers who call, wait, and then hang up before being connected.
The industry benchmark is usually around 5–7%. Anything higher is no longer normal. These are measurable losses that can and should be addressed.
It is important to understand that Abandon Rate is not just about “missed calls.” These are customers who intended to buy, ask a question, or resolve an issue but could not get through. Some will call back. Others will not.
Tracking this metric daily for every queue separately helps businesses understand exactly where and when they are losing real customers.
6. AHT and Utilization: How Efficiently the Team Uses Its Time
These are two metrics that should always be analyzed together.
AHT (Average Handle Time) is the average time spent handling a call, from answering to completing post call work. If one agent’s AHT is significantly higher than the team average, it may mean they spend too much time searching for information during calls or struggle to close conversations efficiently. At that point, it is no longer just a statistic but a clear coaching opportunity.
UTZ (Utilization) shows how much of the shift an agent actually spent working. If an employee worked an 8 hour shift but has a UTZ of only 5%, that is a warning sign. Either the agent spent most of the day on pause or workloads are distributed unevenly.
Together, these two metrics answer a simple question: “We are paying people. What are we getting in return?”
7. Anomalies: What Is Going Wrong Right Now
This is probably one of the most underestimated monitoring features. Most managers either do not know about it or rarely use it.
An anomaly is an automatic system alert that something has gone outside normal parameters. An agent has been on pause for 40 minutes. A queue doubled in size over the last 10 minutes. Service Level dropped below target.
Instead of manually reviewing every metric and looking for irregularities, the manager simply enables the “Anomalies Only” filter and immediately sees only the issues that require attention right now. Everything else is filtered out.
This changes the workflow from “checking everything manually” to “reacting only where there is an actual problem.”
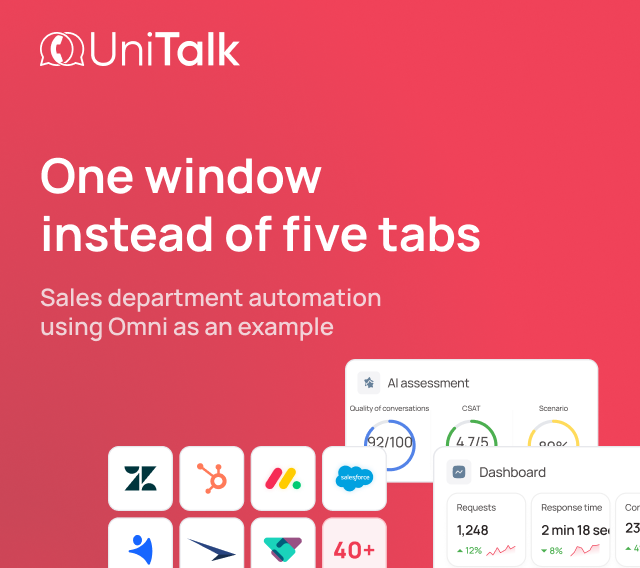
All Seven Metrics on One Screen
Here is what matters most: all seven metrics are not scattered across different reports and tabs. In UniTalk Contact Center, they are all available on a single screen called “Queue and Operator Monitoring.”
At the top is the overall queue overview: Waiting, ASA, Service Level, Total Calls, Abandon Rate, and AHT. Below are individual agent metrics: queue, status, time in status, number of calls, AHT, and Utilization.
One screen and one minute of attention are enough for a manager to understand exactly what is happening in the team right now. Not approximately, not “it seems fine,” but clearly and based on real numbers.
Why This Matters Every Day
A contact center is not a project you launch and forget about. It is a living process where the situation changes every hour.
Everything may look fine in the morning, then a wave of customer requests hits in the afternoon, and without monitoring no one notices it until the end of the day. By then it is too late to fix anything: customers are gone, calls are missed, and performance metrics are damaged.
Reviewing these seven things every day is not bureaucracy or unnecessary work. It is the difference between managing a contact center and simply being present in one.
We will show you how managers can see the entire operational picture on a single screen.