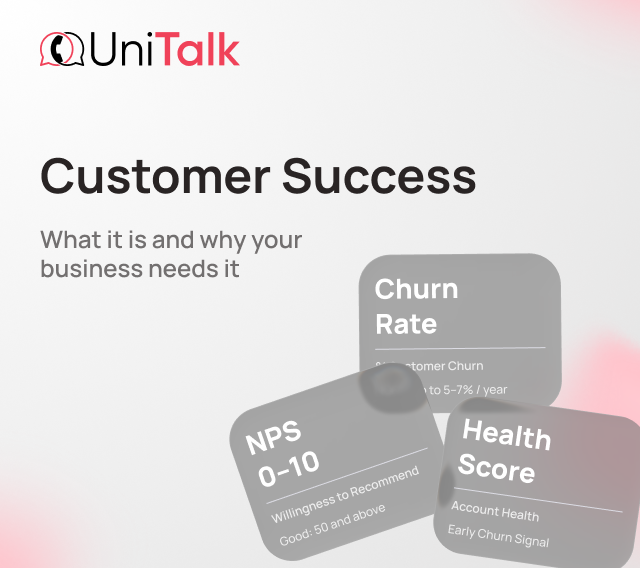
What Is Customer Health Score and How to Use It
Imagine: a client has been working with you for a year and a half. Pays on time, never complained, sometimes even replied to messages. And suddenly – a short message: «We’ve decided to end our partnership.» No warnings. No signals. Just gone.
Sound familiar? Customer Health Score (CHS) exists precisely to prevent this. It’s a numerical metric that collects behavioral signals for each client and answers one question: are they happy, or already looking at competitors? Right now, not after the fact.
Key takeaways
- Customer Health Score is the numerical «pulse» of your client: an aggregated index of loyalty and engagement.
- The index combines several signals: usage frequency, feature adoption depth, reviews, support interactions, ROI, and payment discipline.
- Three main CHS models: point-based (0–100), letter grade (A–F), and the traffic-light color system.
- Calculation: assign a weight and score to each metric, multiply, and sum the results.
- CHS lets you spot churn risk early, prioritize CSM efforts, and find upsell opportunities.
- CHS data is collected via CS platforms, CRM systems, speech analytics, and contact center management tools.
- Most common mistakes: relying on one metric, updating infrequently, and not acting on the results.
What Is Customer Health Score and Why It Matters for Business

The Customer Health Score isn’t just another buzzword from the world of sales. It’s a concrete tool built on a simple idea: instead of waiting for a client to say «I’m leaving», learn to notice it through their behavior – how often they log in, how they respond to support, whether they pay on time.
The metric comes from Customer Success practice – a discipline focused not on the initial sale, but on ensuring clients receive ongoing value and stay as long as possible.
According to Zippia, 65% of a company’s revenue comes from repeat customers, and acquiring a new customer costs 6–7× more than retaining an existing one. An existing client has a 60–70% chance of making another purchase – compared to 5–20% for a new one. And according to HubSpot, 67% of churn could have been prevented if the client’s problem had been resolved on first contact. CHS helps notice these problems before the client decides to leave.
Where Customer Health Score Is Used
First and foremost in SaaS and subscription services, where clients can easily choose not to renew. But today the customer health index is actively used across many industries:
- B2B services – to keep a pulse on corporate accounts with large contracts;
- contact centers – to evaluate client experience after each interaction;
- e-commerce – to segment the customer base and identify VIP buyers;
- financial organizations – to monitor loyalty and payment behavior.
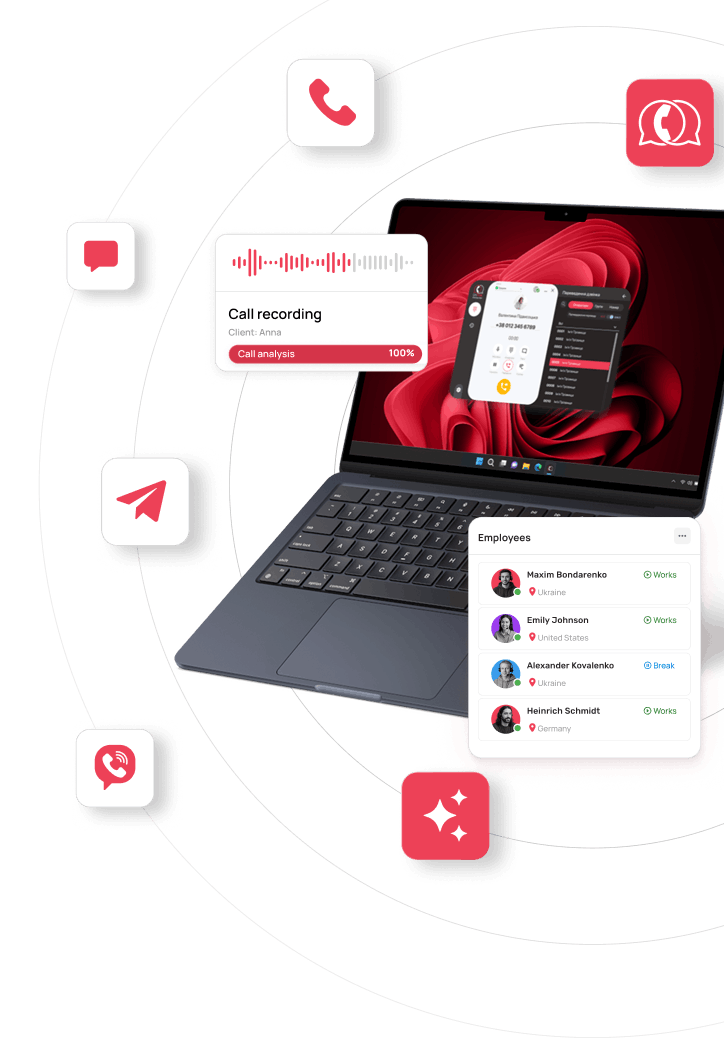
In contact centers, CHS works especially well when data flows in automatically – without manual call listening or Excel spreadsheets. For example, UniTalk Speech Analytics converts every call to text, identifies conversation tone, and detects negative patterns – all 24/7. This data directly feeds the «customer sentiment» component in the CHS model.
What Metrics Make Up the Customer Health Index?

There’s no rigid standard – the metrics depend on your product and business model. But there are several universal groups found in most CHS models. Let’s break them down.
Product Usage Frequency
This is the most obvious and one of the strongest signals. A client who used to log in every day but now visits once every three weeks is already thinking about leaving. They just haven’t said it yet.
But not just any activity counts – only targeted actions: creating records, running processes, working with reports. Visiting the homepage and leaving in 10 seconds is not activity – it’s a warning sign. A drop in targeted activity of more than 30% over two weeks is a reason to call, without waiting for next quarter.
Feature Adoption Depth
Imagine: a client bought a CRM with five modules and uses only one. Technically they’re an «active user». In reality, they see no value in most of what they’re paying for. At the first opportunity – or the first competitive offer – they’ll leave.
Adoption depth is measured as the ratio of actively used modules to available ones. A rate below 40% is a signal for an onboarding touchpoint: show the client what else the product can do and how it solves their problems.
Customer Sentiment
This component is assembled from multiple sources – and rightly so, because a single source is easy to fool:
- NPS and CSAT – direct questions: «Would you recommend us?» and «Are you satisfied with the interaction?»
- Google Reviews, App Store – what the client says about you publicly;
- Call and chat sentiment – what they tell your operators when they think no one is analyzing it.
One low NPS score after a technical issue – not a disaster, it happens. Consistent decline over three months in a row – a red flag that can’t be explained away as coincidence.
Support Interactions
Contact frequency itself is a neutral signal. What matters more: what happens to those contacts? Is the queue of unresolved tickets growing? Is the same question being asked again and again? Are responses delayed?
A client who gets no help leaves quietly. A client who gets fast, relevant answers stays – and recommends you to colleagues. Resolution time and the rate of repeat contacts on the same topic are important CHS signals.
Engagement and ROI
A client keeps paying exactly as long as they see value. So part of CHS is about measuring real benefit: are their key metrics growing since they adopted your product? Do they attend webinars? Do they open your email newsletters, read training materials? Do they engage with the customer success manager proactively – not just when something breaks?
High engagement almost always means renewal. And the reverse – a client who «pays but doesn’t use» – won’t stick around long.
Financial Indicators
This is the most objective signal of all – because numbers don’t lie. A client who delays payment by 30 days for the second time in a row, or who asks to downgrade without an obvious reason – something is probably wrong. They just haven’t said it out loud yet.
And the reverse: a client who engages enthusiastically with your expansion offers and proactively explores new possibilities is clearly happy. This is the perfect moment to invite them to share their experience with colleagues or partners.
Benefits of Using Customer Health Score
The main shift that happens when a company starts working with CHS: it stops fighting churn reactively and starts managing it.
Here’s what that looks like in practice:
- You see churn risk weeks before it happens. A 20% CHS drop over a month isn’t panic-worthy – but it’s definitely worth a call. You still have time to fix things.
- You prioritize without guessing. When a CSM has 60 accounts, CHS literally tells them: these three need a call today, and five more by end of week.
- You find upsell where you least expect it. A client with CHS 9/10 using the product at 95% capacity is clearly happy. Perfect time to offer an upgrade.
- You evaluate team performance on results, not feelings. CHS dynamics in a manager’s portfolio are more honest than any subjective report.
- You get product insights. Which module does nobody use? Where do complaints cluster? CHS collects this data automatically.
- LTV grows. According to Forrester (2024 CX Index), companies that put the customer at the center of their business show 49% faster profit growth and 51% better retention. CHS is one of the key tools for getting there.
Common Customer Health Score Models

Point-Based Model
The most common model. The final CHS is a number from 0 to 10 or 0 to 100. Each metric gets a weight and a score; the weighted values are summed. The advantage: you can track trends – last month 6.8, this month 5.1. Something went wrong, and you need to find out what.
Example: CHS = 7.25 / 10 → «green zone», scheduled touchpoint every two weeks. CHS = 4.1 → «yellow zone», proactive call within two days.
Letter Grade Model
A – excellent, B – good, C – concerning, D and F – time for urgent action. This model works well for executive communication: no one needs to explain what an F means. Everyone understands immediately.
Color Coding Model
Green – yellow – red. The most visual model for operational dashboards. A manager opens their screen in the morning and immediately sees where things are on fire. Usually built on top of the point model: the numerical score is «translated» into a color using preset thresholds (e.g., 0–40 = red, 41–70 = yellow, 71–100 = green).
How to Calculate Customer Health Score: Step-by-Step
Good news: you don’t need complex math or an expensive consultant. A basic CHS model can be built in one working day. Here’s how.
Step 1. Identify the key signals
Compile a list of metrics that genuinely affect whether clients stay. No more than 8–10 – otherwise the model becomes unmanageable. For each metric, ask: «If this indicator drops by half, will we notice it in our results?» If yes – the metric belongs.
Step 2. Determine the importance of each metric
Distribute 100% among your metrics. Don’t make all values equal – that’s the most common beginner mistake. Usage frequency and payment discipline in SaaS almost always matter more than the number of knowledge base articles read. Start with your CS team’s expert judgment, then refine using last year’s churn data.
Step 3. Normalize the scores
To compare different metrics against each other, convert each one to a common scale – for example, 1 to 10. Activity once a week = 4, every day = 10. NPS = 9 → score 9, NPS = 4 → score 4. Simple.
Step 4. Calculate the weighted sum
Multiply each metric’s score by its weight and add them up. That’s your Customer Health Score. Below is a sample calculation for a hypothetical client:
| Metric | Weight | Score (1–10) | Weighted score | Comment |
|---|---|---|---|---|
| Usage frequency | 25% | 8 | 2,00 | Logs in every day |
| Feature adoption depth | 20% | 6 | 1,20 | Uses 3 of 5 modules |
| Customer sentiment (NPS) | 20% | 7 | 1,40 | NPS = 7, neutral |
| Support interactions | 15% | 5 | 0,75 | Several open tickets |
| Engagement & ROI | 10% | 9 | 0,90 | Conversion up 18% |
| Financial indicators | 10% | 10 | 1,00 | Always pays on time |
| TOTAL / CHS | 100% | – | 7,25 / 10 | Status: ‘Healthy’ – green zone |
Result: CHS = 7.25 / 10 → green status. Everything looks good, but the 0.75 support score is worth a look – which tickets are still open? A great reason for a quick call.
Step 5. Set thresholds and actions
Without concrete actions, CHS is just a number. Each range needs a clear scenario – who calls, when, and with what offer:
- 0–4 / red – immediate CSM call, escalation to management, account rescue plan;
- 4–7 / yellow – proactive check-in, identifying reasons for decline, onboarding to underused features;
- 7–10 / green – scheduled touchpoints, finding upsell opportunities, invitation to share their experience.
Mistakes When Working with Customer Health Score
The model is built, data is flowing, the dashboard looks great. But clients are still leaving without warning. Chances are, one of these mistakes has crept in:
| Mistake | Why it hurts | How to fix it |
|---|---|---|
| One metric instead of several | You only see part of the picture and easily miss real problems | Include 5–6 diverse metrics |
| Equal weight for all metrics | Minor signals override critical ones | Prioritize metrics according to business logic |
| Infrequent recalculation (quarterly) | You learn about the problem when the client has already decided to leave | Recalculate weekly or by trigger |
| Warning signals – no response | Churn hits unexpectedly | Set alerts when CHS drops below threshold |
| No clear action plan | The metric exists for its own sake | Tie each CHS range to a specific team action |
And one more trap rarely mentioned – the «frozen» model. CHS was set up a year ago and nobody has touched it since. But the business changed, the product grew, new customer segments appeared. Review the weights and metrics at least every six months – otherwise the model will start lying to you.
Tools for Tracking Customer Satisfaction
Now for the practical part: how to calculate all of this without spending half your life in Excel and manual analysis? Here are the key tools – from simple to advanced.
Dedicated Customer Success Platforms
Gainsight, ChurnZero, Totango – the «heavy artillery» of CS. They automatically pull data from your product, CRM, and support, calculate CHS themselves, and send alerts to managers. If you have hundreds of subscription clients – this is a must. If dozens – you can start with lighter tools.
CRM
Salesforce, HubSpot, Pipedrive let you build a simplified CHS model right inside the pipeline – through custom fields and integrations. Not as powerful as dedicated platforms, but no additional costs. For small teams – a good starting point.
Contact Center Management System
If your primary channel is voice, CHS is largely determined by how well your operators’ work is organized. Chaotic queues, missed calls, uneven workloads – all of this silently damages the client experience, and therefore the health score. UniTalk Contact Center (UCC) turns call center operations into a managed process: it organizes inbound and outbound flow, monitors operator load, and gives management a real picture of team performance. Fewer lost clients at the entry point means higher CHS on the output.

Speech Analytics
Most of the most valuable CHS signals live in calls – in tone, words, pauses. But manually listening to thousands of conversations is not realistic. UniTalk Speech Analytics does this automatically: converts call recordings to text, identifies sentiment, detects negative patterns, and flags script deviations – without human involvement, 24/7, across 100+ languages. This data becomes part of the «customer sentiment» component in your CHS model.
Survey Platforms
Typeform, SurveyMonkey, Google Forms – for NPS and CSAT surveys. A simple, low-cost way to regularly update data on customer sentiment. One short survey per quarter is enough to keep the «sentiment» component of your CHS model current.
Conclusion
Clients don’t leave suddenly. They leave gradually – first they stop logging in every day, then they delay a payment, then they stop responding to messages. Customer Health Score helps you notice these signals in advance – before the client has made a final decision to leave.
You don’t need to start with a perfect ten-metric model. Take 5–6 indicators you already have, assign their importance, and agree on who responds to each signal and how. That takes one working day.
Customer Health Score is not just another KPI. It’s an early warning system that helps you retain clients not reactively, but proactively. Which means – reducing churn, growing LTV, and scaling alongside your clients.